Instrumentation: Instrumenting HTTP Services

Welcome to the second week of our blog post series on instrumentation, curated by Julia and Charity. This week will focus more on operational and practical examples; check out previous entries for awesome posts on Finite State Machines, The First Four Things You Measure, and more!

Instrumenting HTTP Services

I spend most of my time at VividCortex working with and building tools for database instrumentation. We’re a SaaS platform with lots of HTTP services, so I spend time thinking about HTTP instrumentation too. Here’s my approach.

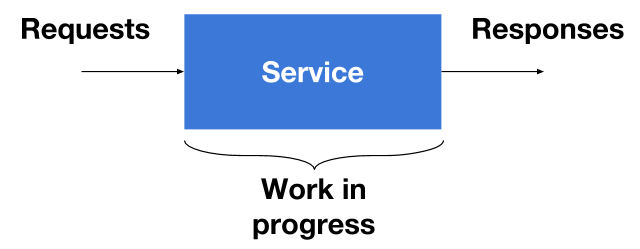
Services have three sections that we need to instrument. There’s the point where requests are coming in, in the middle where work is getting done, and finally where responses leave. For the most part, the results of instrumentation are log events. Log events are simply appended to a log file and are eventually aggregated.

Logging Requests

The first thing we do when we receive a request is uniquely identify it using an ID. In our case, IDs are random hex strings. Here’s how you can create a hex ID in Go:

import "crypto/rand"
import "encoding/hex"

func generateRequestID(length int) string {
        b := make([]byte, length/2)
        _, err := rand.Read(b)
        if err != nil {
                panic(err)
        }
        return hex.EncodeToString(b)
}

Go playground version: https://play.golang.org/p/aVfrWdEcSD

Once we have a request ID, we can log the request details right away. The request ID, method, and URL are a good starting point. I like using logrus as my Go logging package because it allows me to create structured log events, like so:

log.WithFields(log.Fields{
        "request_id": requestData.RequestID,
        "method":     r.Method,
        "url":        r.URL.String(),
}).Infof("[Req %s] %s %s", requestData.RequestID, r.Method, r.URL)

That generates events that are really easy to aggregate because they’re JSON objects:

{
  "level": "info",
  "method": "POST",
  "msg": "[Req 65073a5e] POST /login",
  "request_id": "65073a5e",
  "time": "2017-01-14T00:14:25-05:00",
  "url": "/login"
}

After that, there really isn’t a strong need to log things during the handling of the request unless there’s an error. If there is an error, we simply add another log event with the error details:

log.WithFields(log.Fields{
        "request_id": requestData.RequestID,
        "error":  err.Error(),
}).Warnf("[Req %s] %v", requestData.RequestID, err)

Notice that I’m not including information like the method or URL. We don’t them because we already associated that information with the request ID.

Logging responses

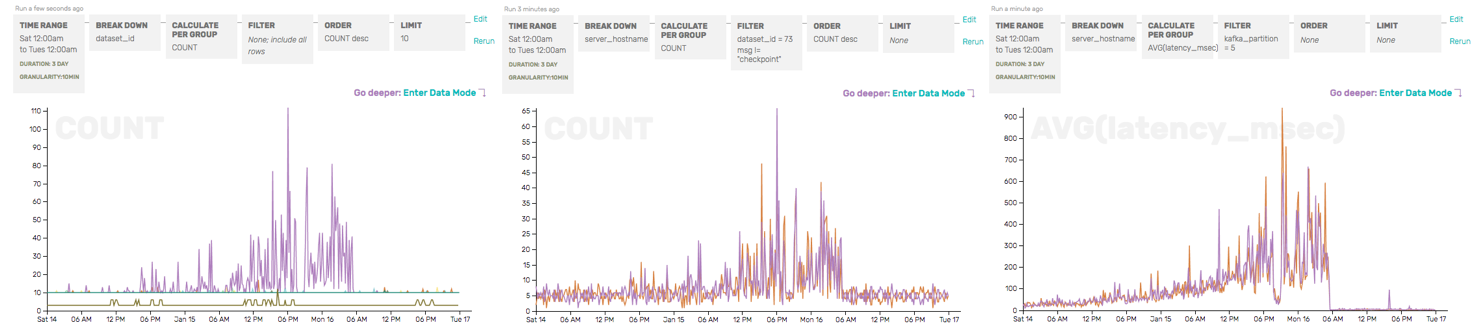
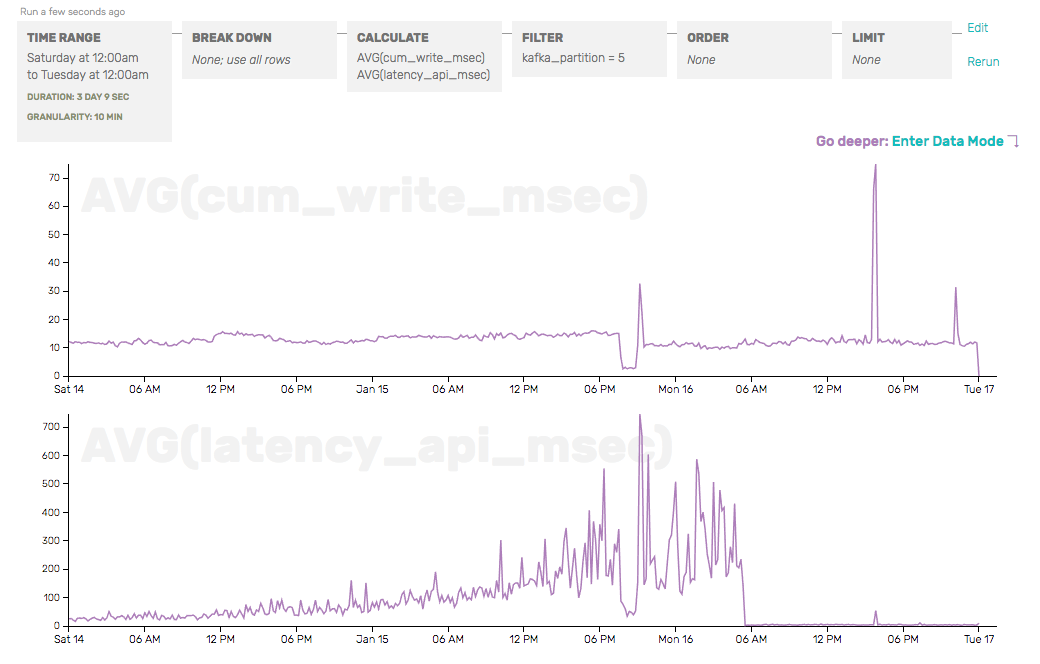
Finally, when the request has been handled, we need to include a final event with the response details. Logging the response information is just like the request, except now we have more information to work with. The latency and status code are good picks because we can use them to trace errors and manage request performance.

log.WithFields(log.Fields{
        "request_id":  requestData.RequestID,
        "method":      r.Method,
        "url":         r.URL.String(),
        "status_code": statusCode,
        "latency":     latencyDur.Seconds(),
}).Infof("[Req %s] %s %s status code %d latency %v",
        requestData.RequestID, r.Method, r.URL, statusCode, latencyDur)

Monitoring work in progress

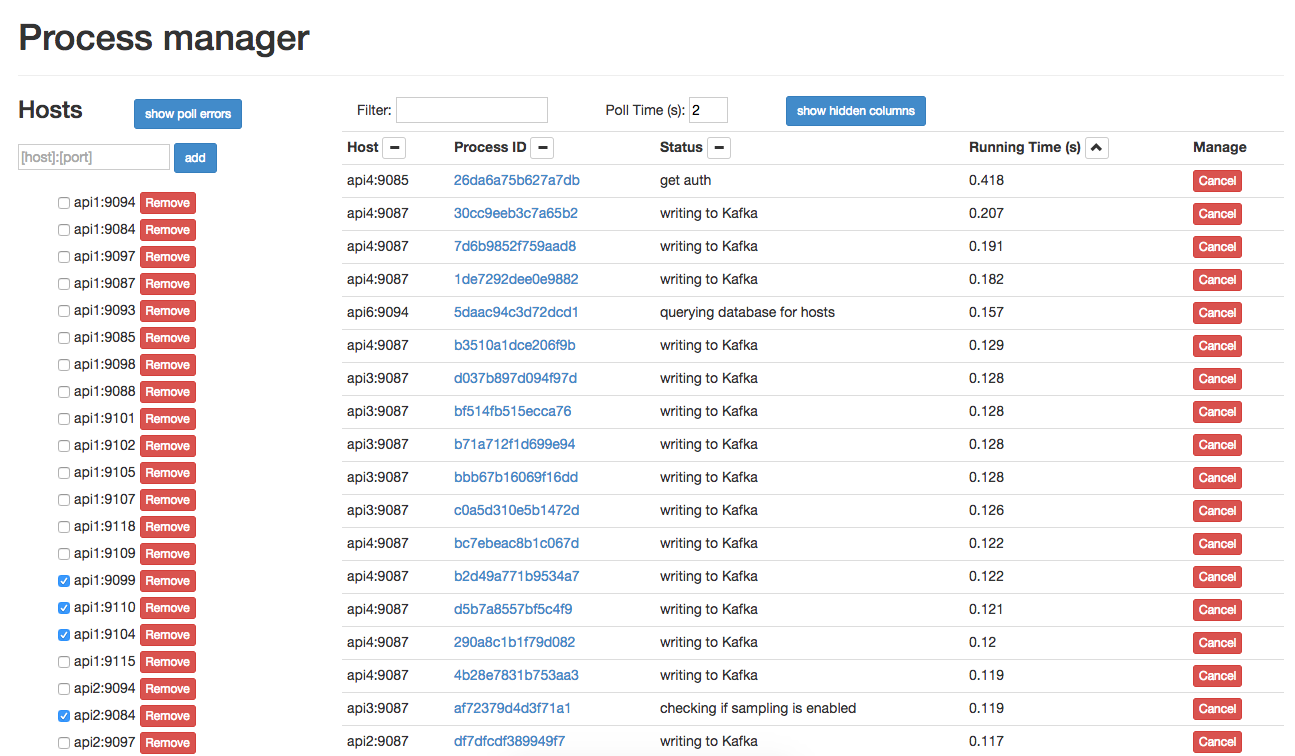
What about stuff in progress? How do you find out what’s happening right now, like you can with top? At VividCortex, we wanted something like that for our web services, so we developed pm. pm is a Go package that lets you integrate process management into an application. In a nutshell, pm allows users to create a process list with an entry for each running request, and have a dynamically-updated status for each of those requests. It’s been really useful when tracking down long-running requests that cause problems.

Once we hook in pm in our applications, we make sure we call pm.Status in strategic locations in our code to update the status of each of our HTTP requests. For example, before parsing request parameters in a request, we call the following

pm.Status(requestID, "parsing request parameters")

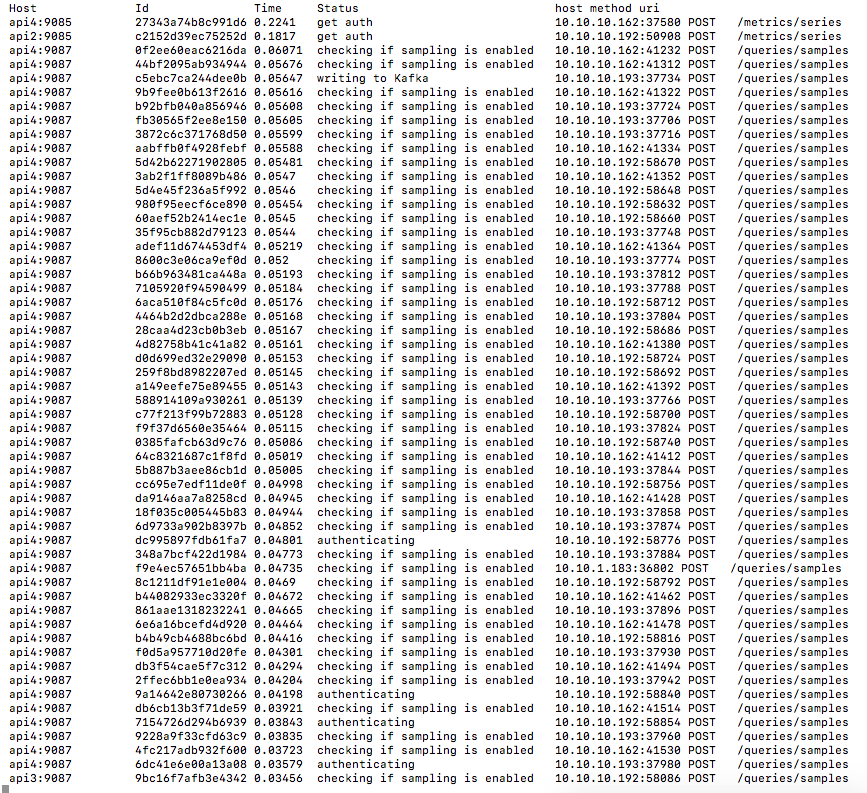
and the status would be set accordingly until the next pm.Status update. Then, whenever we need to see what’s running on a service, we simply use pm’s REST API to get a snapshot of the process list. We have a web UI and a CLI to use with the REST endpoints.

Instrumenting further

Of course, there’s lots of other things you can do to instrument services further. One simple modification that really helps when you have several interacting services is to reuse the same request ID when a request traverses through services. Once you’re at that point, there probably isn’t much left to instrument in your applications. Now you’ve come to the real hard part: making sense of all of the information your instrumentation generates. :)

Happy instrumenting!!

Thanks again to Preetam Jinka for their contribution to this instrumentation series!

How Honeycomb Uses Honeycomb, Part 3: End-to-End Failures

At Honeycomb, one of our foremost concerns (in our product as well as our customers’) is reliability. To that end, we have end-to-end (e2e) checks that run each minute, write a single data point to Honeycomb, then expect that specific data point to be available for reads within a certain time threshold. If this fails, the check will retry up to 30 times before giving up.

Monday morning, we were notified of some intermittent, then persistent, errors in these automated checks.

We quickly verified that only one of the e2e checks was failing by checking the COUNT (as a sanity check, and to show where failures were occurring) and the AVG write/read durations (just to get a head start on identifying the root cause of the e2e failures), broken down by partition and success:

GIF: Recording of inspecting end-to-end results
The COUNT here shows that, overall, there are only a few failures (dark maroon) for e2ep5—but those correspond with a giant increase in AVG(read_duration)... and that read_durations are elevated even for successful e2e checks for p5 (the green line).

So we’ve confirmed that only partition 5 seems to be having trouble—and that, from a client’s perspective, the write to our API server looks perfectly normal. It’s the read (which relies on the write successfully passing through Honeycomb and being made available for reads) that seems to be the problem here.

While debugging this, we ran into an issue that plagues many an incident-response team: lots of our query results were showing turbulence around the time in question, but which came first? What was the cause?

A few redundant graphs
Graphs from three different datasets, looking at the problematic time period from three different perspectives, all of which told us something was wrong but not quite why.

As we sifted through our data, graphing interesting metrics and breaking them apart by attributes we hoped might be interesting, we eventually placed cum_write_time and latency_api_msec next to each other—two timers that represent two slightly different things (the cumulative time spent just writing to disk for a set of payloads, and the time since API server handoff to Kafka for the last payload). We also isolated the partition we knew was problematic:

Comparing two latency functions against each other

This is enough to tell us that the problem isn’t in our API server writing to Kafka (the e2e check’s write duration would reflect that) or our storage server writing to disk (the cum_write_time would reflect that), but instead in between—and we should take a hard look at the moving parts related to partition 5 in Kafka.

There are some fundamental problems that are difficult to impossible to automate—why was something named poorly, correlation vs causation—but Honeycomb let us quickly slice and compare metrics against each other, along different dimensions, to quickly rule out factors that didn’t actually matter (dataset, server hostname) to hone in on the metrics that really showed what was wrong.

Curious? Give us a try!

Honeycomb is a next-generation tool for understanding systems, combining the speed and simplicity of pre-aggregated time series metrics with the flexibility and raw context of log aggregators. Sign up and give us a shot today!

Instrumentation: Worst case performance matters

This is the fifth in a series of guest posts about instrumentation. Like it? Check out the other posts in this series. Ping Julia or Charity with feedback!

BrightRoll’s Realtime team is responsible for a service, Vulcan, which provides a set of developer-friendly APIs for interacting with the data involved in deciding whether to serve an ad. It is a threaded, event-driven application written in C. As Vulcan is in the critical path of ad serving, it has a very tight SLA: <5 ms response time and 100% availability.[1]

One otherwise fine day, the ad serving team noticed that they were seeing a high timeout rate for all queries to Vulcan. So, we checked our performance metrics: everything looked pretty solid, with 95%ile figures well within SLA.

After a few false starts and blaming the network as per SOP[2], we decided to take a look at sample-based CPU profiling, which confirmed that 15% of time was going to user data record decompression – largely in line with our past experience. User data records include a long list of “segments.” These are used for targeted advertising, like “people who want to buy a planet ticket to Europe soon;” this adds up to lot of data, so it’s stored in a proprietary compressed format.

On a hunch, we extended the performance monitoring system to start tracking worst-case performance. That got our attention very quickly: the maximum times were over 15 ms! The latency distribution was awful:

%ile   Response time
95      2.5 ms
99      4.0 ms
99.9    5.9 ms
99.99   8.0 ms
100    16.4 ms

We quickly figured out that this response time was dominated by user data record decompression, and that decompression time was linear with the number of segments a user was associated with: the 95%ile users were only in 1,400 segments, but the worst-case users were in over 10,000! Clearly these users were either very strange (or associated with fraudulent behavior).

However, even accounting for slow decompression operations, we couldn’t account for the magnitude of SLA violation reported by the ad decisioning team.

The answer turned out to be simple once we saw it: this is an event-driven architecture. While a given thread is occupied decompressing a huge user record, new inbound requests queue up. They are not marked as being “started” until they are parsed and routed to the right endpoint, so even though from Vulcan’s point of view the transaction only took 1ms, it might have been sitting in queue for 10+ms!

Now that we knew where the problem was, one engineer knocked out a quick fix: we capped the number of segments per user at 2048, which cut the worst-case latency back to sane levels and largely eliminated the appearance of the thread stall problem.

We also implemented a longer-term way of monitoring SLA compliance, but that is a story for another day.

I think there are four good lessons here:

  1. Start paying attention to worst-case performance. Maybe you don’t have a system where 0.1 ms matters, but you’ll still find broken stuff.
  2. Make investments in tooling up front and follow a scientific method – hypothesis-test-repeat – in debugging performance problems. Chasing down rabbit holes isn’t an efficient way to fix your business.
  3. Performance measurement that occurs entirely within your application has serious limitations that you need to be aware of. (GC pauses, anyone?)
  4. Thread busy stalls in event-loop driven applications suck super bad.

[1] If Vulcan stops responding, business performance degrades dramatically. We really do aim for 100% availability.

[2] #protip It’s never the network. It wasn’t this time either.

Thanks again to Gian-Paolo Musumeci for their contribution to this instrumentation series!

Instrumentation Is About Making People Awesome

This is the fourth in a series of guest posts about instrumentation. Like it? Check out the other posts in this series. Ping Julia or Charity with feedback!

The nuts and bolts of metrics, events, and logs are really interesting to me. So interesting, perhaps that I get mired in these technical bits. I keep thinking of ways to process more data, allow for more fields or finer precision. I think about this so much that I drift in to worrying more about the work than the outcome.

I bet you do this too.

Instrumentation of your systems — making them observable — is more about the people than the work. Computers don’t really need instrumentation on their own, we only build it for humans (or control systems). Once you’ve ticked the basic monitoring boxes and have the alerts set up, are you done?

Making People Awesome Is The Product

I recently read Baron Schwartz’s “Product Market Fit” post and thought about how I spend most of my day thinking about time series databases, metrics protocols, sampling, and approximate percentiles. In reality though, my actual product is empowering the engineers of Stripe to be more awesome. You see, it doesn’t matter how fast my queries run, how accurate my percentiles are or how well that GIF fits in to my email if at the end of the day an engineer can’t determine if their recent deploy is working the way they expect.

Observability is about inferring the state of systems, right? Then as a team and industry are we measuring and improving how our users are able to gaze in to the crystal ball of our tools and find that clue that unlocks that performance problem, outage or efficiency gain? That is what we’re selling after all, as an internal team or a startup. Making people awesome at that work is our goal. It’s about leveling the playing field for veterans, juniors or specialists. It’s about bringing that spark of insight.

How To Make Awesome

I’m sorry to break it to you, but I don’t know the answer to “how do we make people awesome at observing”. I have lots of ideas though, and I bet you do too! I’d love to hear them but since this is my post I’m just talking at you. I’m going to throw out ideas to get us going:

  • Can we capture how long it takes for our user’s to find the “clue” as to an outage’s source? A “Mean Time To Clue” seems like a great way to gauge our success and weight improvement.
  • How can we get quick clues? Can our tools be more interlinked? Does our metrics dashboard link to our log indexer? Does that alert have a link to a runbook? Is there a way to fire up the bat-signal for help?
  • Can we make things easier? Can we measure and reduce toil in our common interactions? Could steps be automated or removed? Could we draw a picture instead of making so much text?
  • How foolproof are we? Could we take away some work? Can common operations and be pre-instrumented in libraries to avoid users having to even think about them? How can we make users more aware they exist?
  • Can we empower more? Are upstream and downstream services clearly known and can their health be surfaced?

We’re spitballing, but what I find so invigorating is that every one of these questions we thought of in 20 minutes can be mined deeply. If we keep focusing on our user’s needs then we’ll be less likely to lose ourselves in implementation and instead focus on delivering more value.

Reflecting On Your Awesome Widget

Whatever widget you make, it’s really valuable to step back and look at your user’s goals and less at your technology. Metric versus log or tags versus dotted names are less important than your user being confident in their ability to develop, deploy and debug. Every one of those verbs has a whole host of clever improvements we can make. All we’ve gotta do is focus on the making those users awesome.

Thanks again to Cory Watson for their contribution to this instrumentation series!