MongoDB and Honeycomb: My First 10 Minutes

Real-world examples

An interesting side effect of the devopsification of the software industry is how many software engineers and operations engineers increasingly find ourselves in the role of “Accidental DBA,” responsible for operating, debugging, and maintaining a variety of storage solutions at scale.

(Noobs may be interested in Maslow’s Hierarchy of Database Needs, a talk I gave last year on what you should care about and think about as an accidental DBA from the systems or software worlds.)

This can be terrifying at times, but also terrifically fun. :) Databases are complex and opaque and can be challenging to debug. Fortunately, Honeycomb is ideally suited to help people like us bridge that gap, and start confidently navigating the intersections between your software and your storage. (In fact, one inspiration for Honeycomb comes from a piece of software originally designed to help Facebook get some visibility into MySQL! It’s a natural fit.)

Getting data in

Our connector for MongoDB configures an agent to parse and transmit your MongoDB logs. Follow the instructions to turn on full debug logging, set up the connector, and start shipping everything in to Honeycomb.

The connector and agent are both open source and can be set up on any machine with direct access to log files. (Support for hosted MongoDB clusters is coming soon!)

Asking interesting questions

Let’s start with a few basics. As someone with some experience in MongoDB—or any other database—you probably have an idea of what to look for.

There are a bunch of typical database questions and problems that are very useful to be able to answer quickly.

  • Display requests per second and look for any patterns or spikes
  • Break down all the query types that are getting sent in to my system, and look for read/write ratio
  • Get rid of any noisy data in the logs that isn’t related to query traffic
  • Look for replication delays, or failing health checks
  • Find the slowest queries. Find any collections or databases that are hot spotting
  • Am I missing any indexes? (aka, Am I doing any accidental full table scans?)
  • Do I have any terrible un-optimized queries that are fucking with my query planner?
  • Am I reading or writing too much data per query?
  • Do I have any query families dominating lock consumption?
  • What are the queries that I am running that are consuming the most resources? How have they changed over time? When was a query family first deployed?
  • Trace an outlier query back to a raw result to see where it’s failing
  • Show all queries and query families for a given UUID

In this post, though, let’s focus on orienting ourselves with our dataset and using Honeycomb to explore it.

Getting started: isolating by db name, collection and operator type

We can start by just getting a count of queries per second, and then break it down further by operator type (insert, update, query, etc) and collection to see what sorts of queries our clients are issuing.

Screenshot: Breakdown by Operator Type

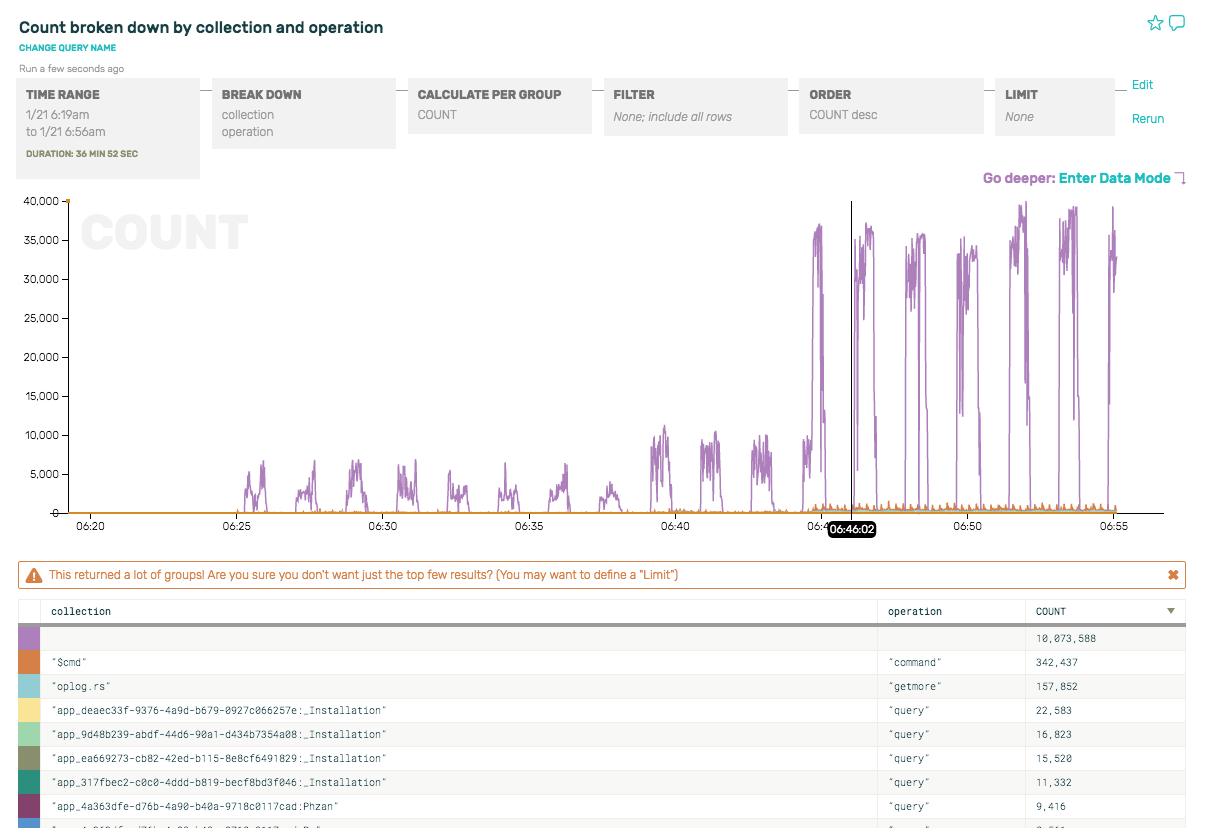
Hmm. There are some periodic spikes that look curious. But the predominant event by far doesn’t even have a query or associated collection at all. What is it?

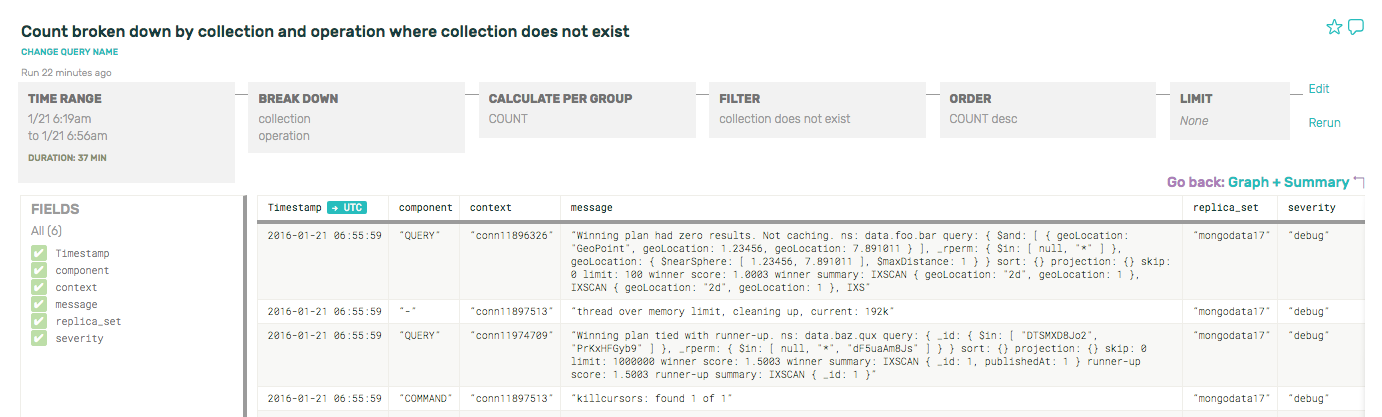
If we zoom in to one of the minute-long purple spikes there, and peek at the underlying rows, we can see that it’s actually the health checks and other internal commands that mongo executes every other minute. Since we have turned on debug-level mongo logs, all this non-query-related stuff shows up in the logs and is picked up by Honeycomb:

Screenshot: Sanity checking

If you’re curious about the mongo internal commands and what they’re doing, for example, break down by command type and see what’s happening under the hood on just the $cmd collection. Screenshot: split by cmd ops

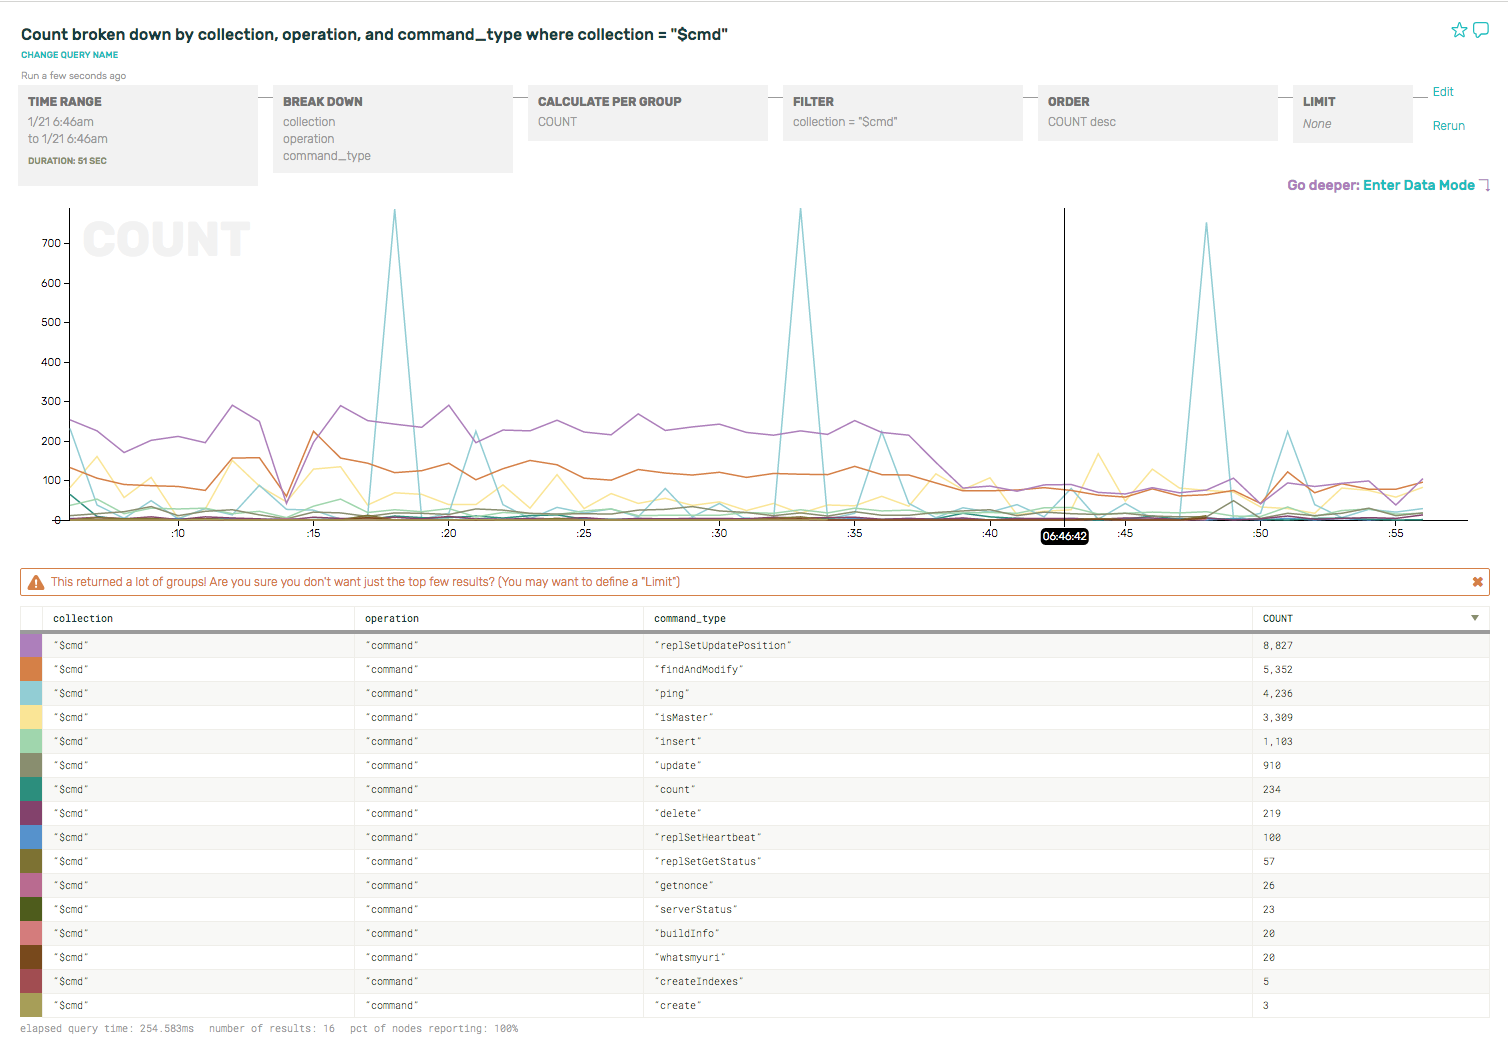
Pretty cool, right? You can see that the replica set heartbeats (command_type == “ping”) and the clients ask whether the node is the master (command_type == “isMaster”) before sending a write. (If not, clients will disconnect and reconnect/re-request replica set state info.)

There’s a few more goodies like this—if you inspect just the oplog.rs collection, you’ll see all the tailable cursors on the oplog collection, doing getmores from IP addresses corresponding to the secondaries’. If you are having problems with replication errors or lag, this is a good place to start looking for those.

Filtering out the noise

But as interesting as all this is, it isn’t super relevant for a DBA trying to get a sense of what’s happening in terms of queries, performance, etc. So to filter out the noise, let’s remove some of the internal commands by adding filters: get rid of severity == “debug”, collection == “$cmd”, collection == “oplog.rs”, in order to limit the results to queries that are coming from our apps and services.

Let’s look at a few basic queries we might run to get a sense of what kind of traffic this replica set is serving.

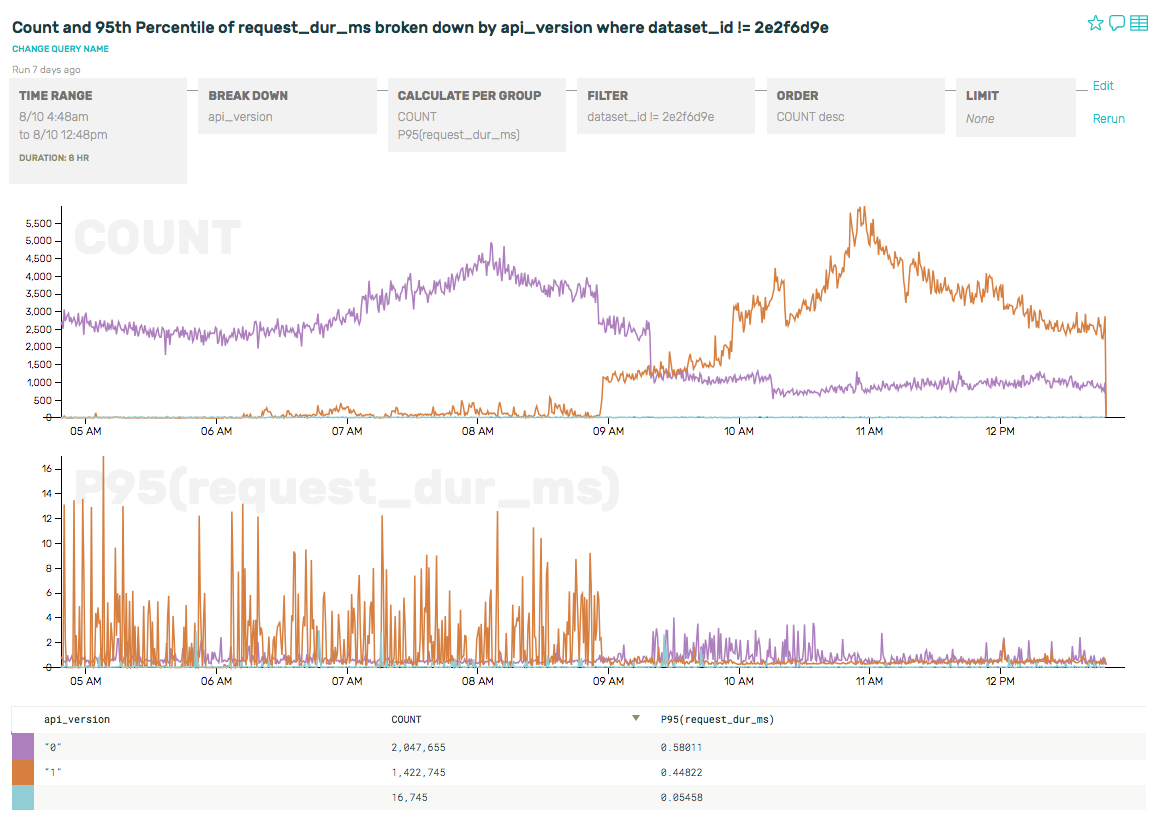
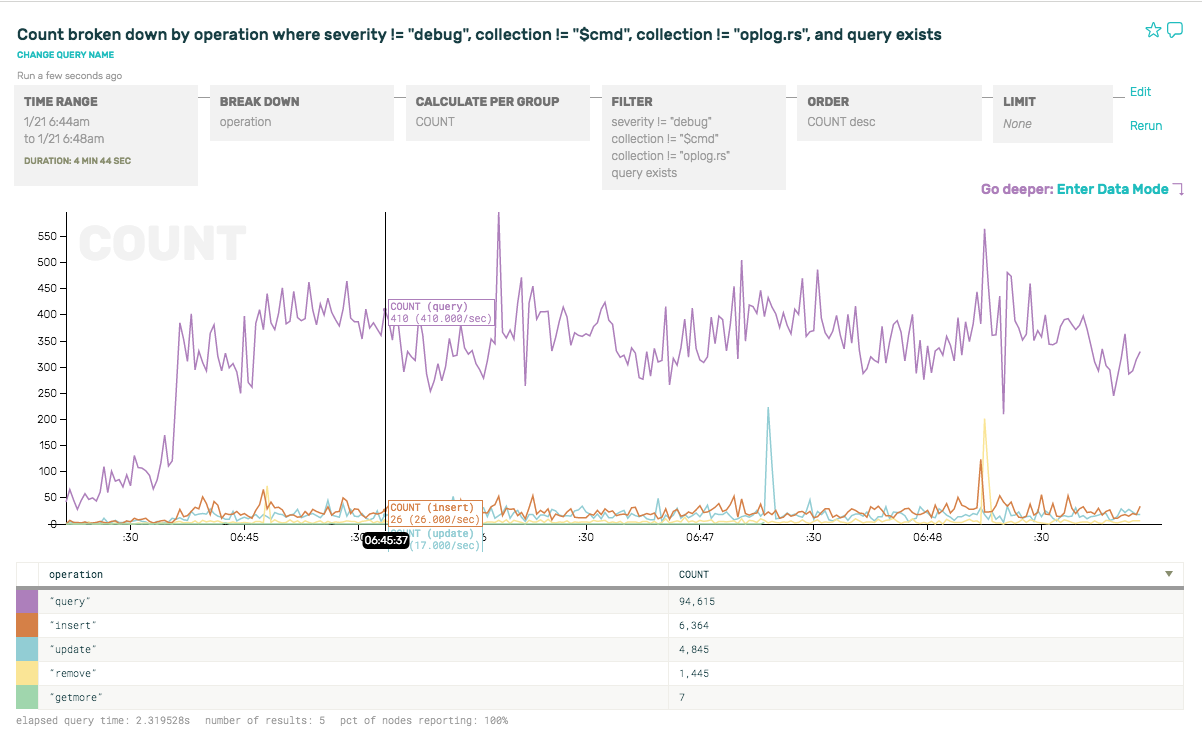
Now that we’ve stripped out the noisy internal traffic, we can re-run the sort of breakdown we looked at earlier and look at the ratio of query types are for reads vs writes, breaking down by operator type. As you can see, about 93% of the queries are reads, and the rests are writes (insert, update, remove):

Screenshot: Zoom In By Op Type

Note that we only have one node here, just the primary node, and that we can only inspect whatever data we get from turning on full query logging for this node. We haven’t yet tossed in the query traffic from secondaries, or enriched it with other important details like pending queue length, system metrics, election events, snapshots or backups, terminated queries, AWS instance type, available RAM, etc etc. We’ll get to that in later posts—we’re only barely getting started!

Let’s add database to the breakdown, in order to find out all the database names, and query count/sec/database. And we’ll do the same with collection to see which collections are hottest.

Screenshot: Top Query Count

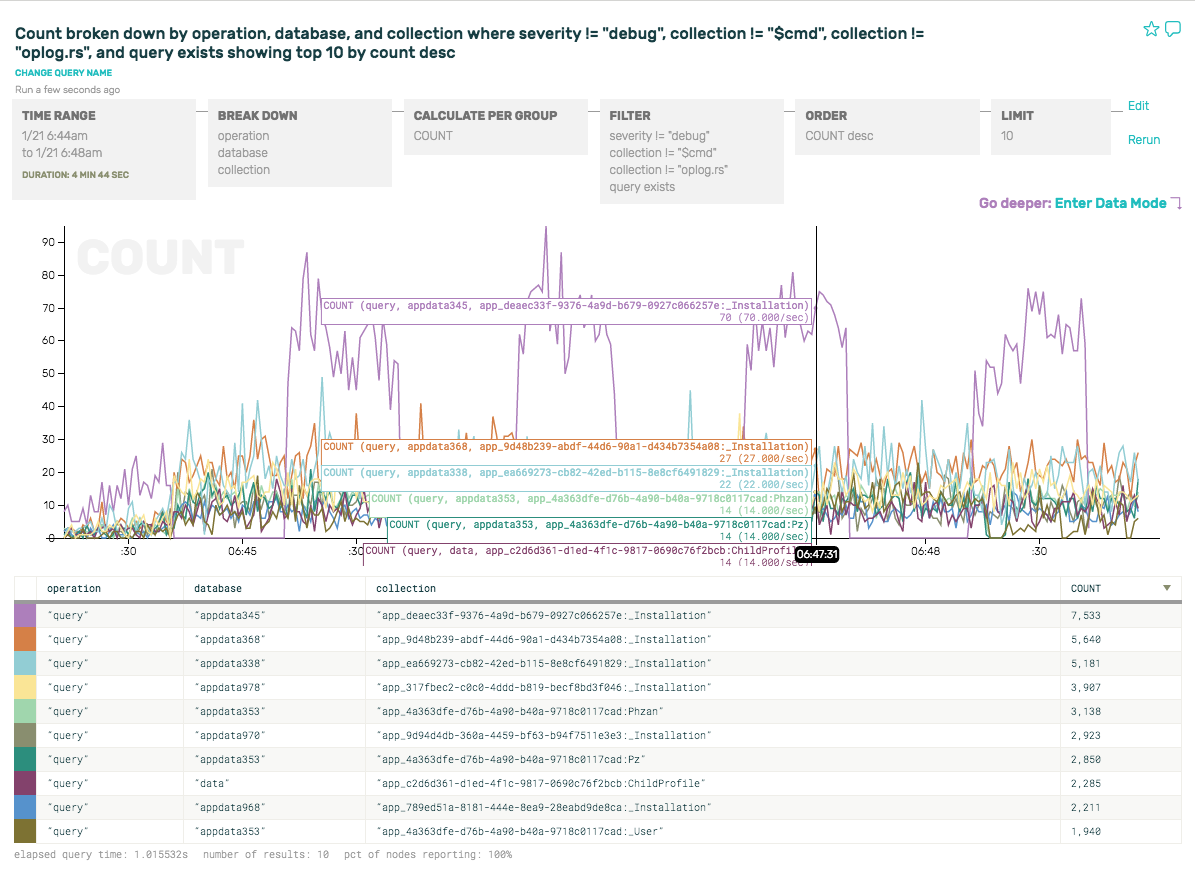
Here you can clearly see that the most common query is on the appdata345 database, where the top query averages out to about 7 req/sec over time—but spikes up to 70 req/sec for intervals every minute (see hover-over numbers for the purple spike):

Screenshot: Normalized Queries

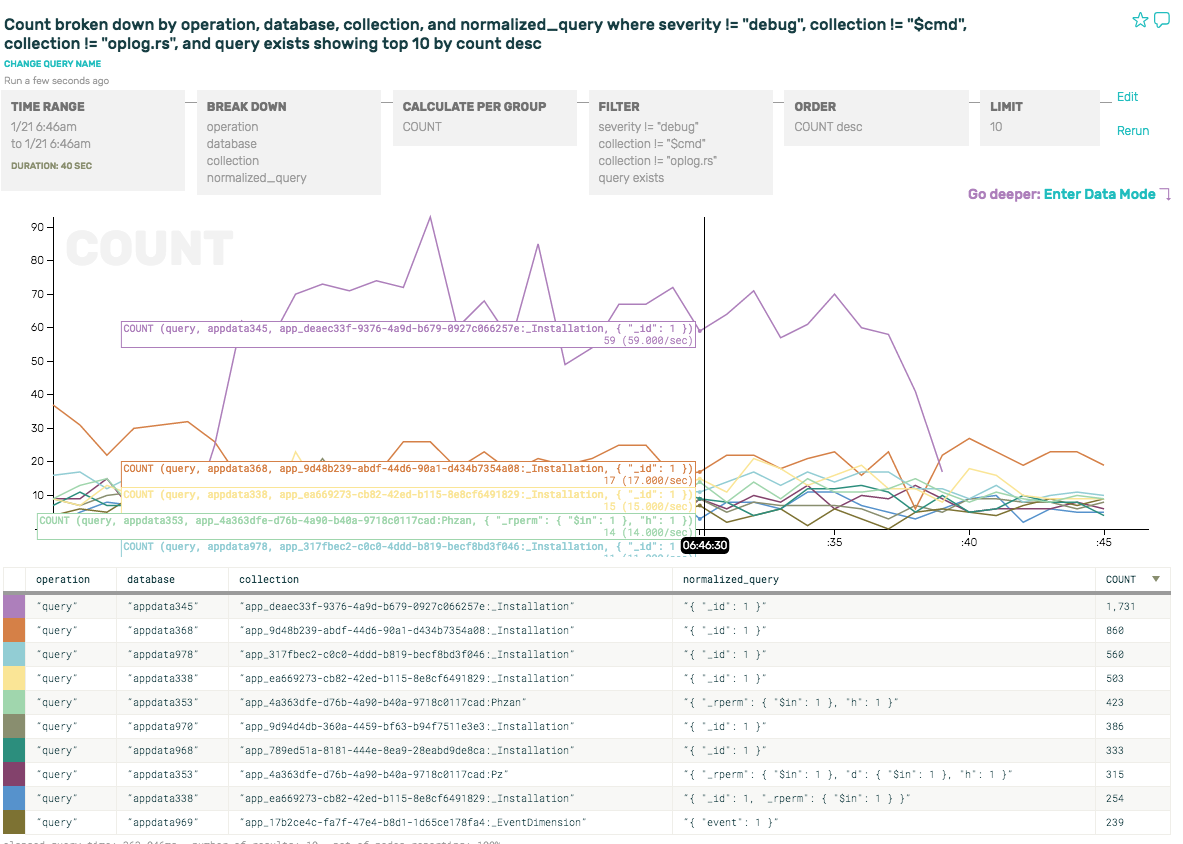
But its most common normalized_query is pretty boring: { "_id": 1 }. Let’s take a look at the appdata353 instead, the 8th row down. Its normalized_query looks a little more interesting. We add a filter to drill down to just that database (database = “appdata353”) and—finally—dig into some actual interesting queries by entering Data Mode.

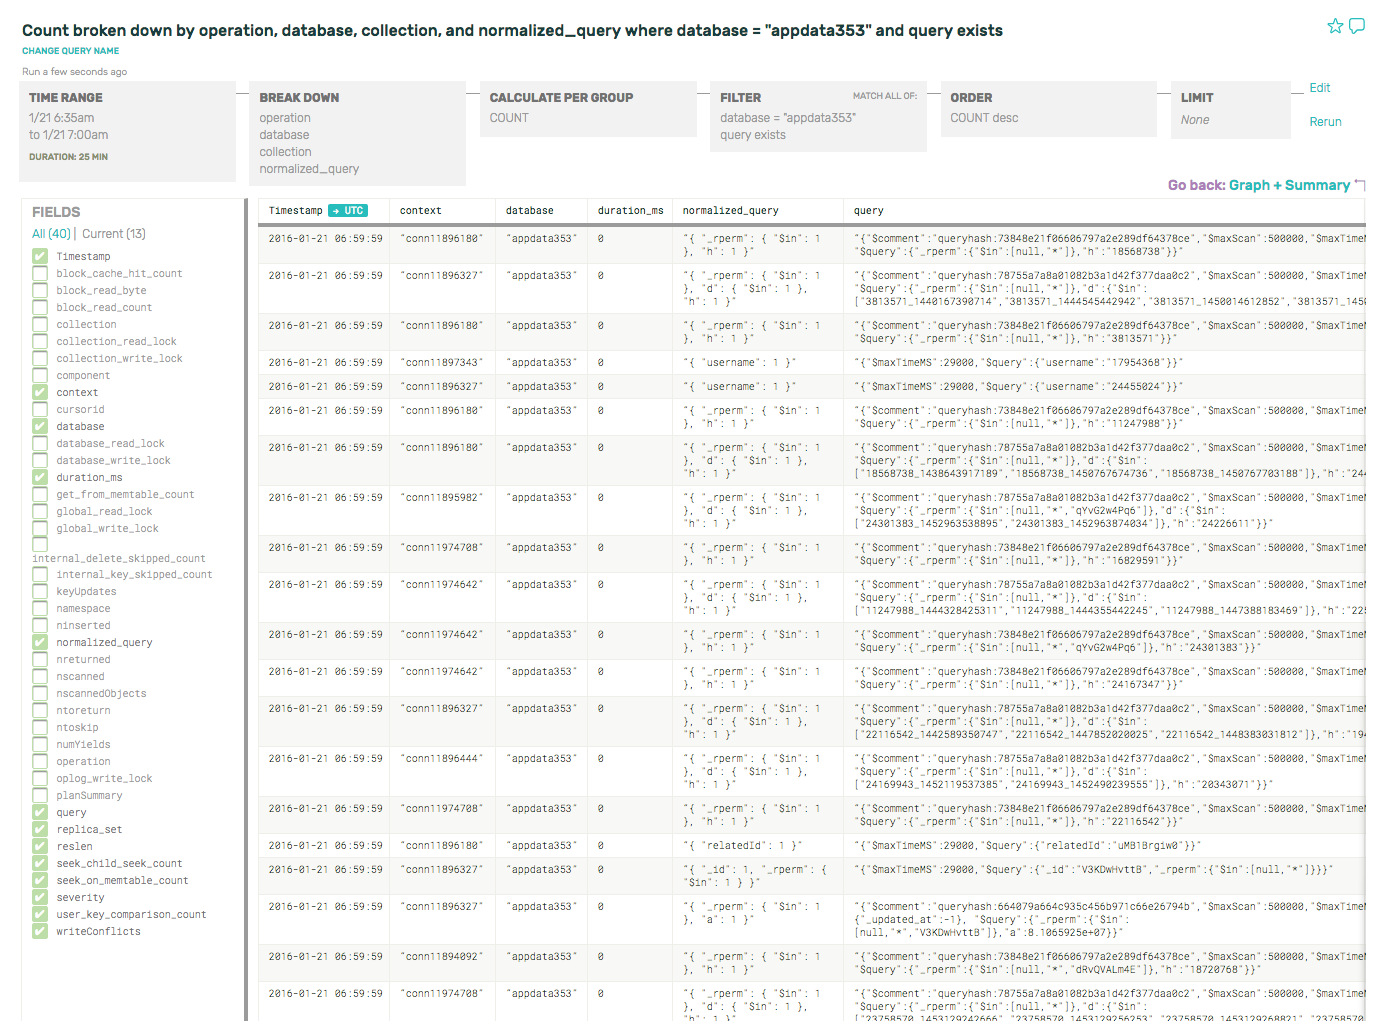
Below, we can see all the normalized queries, raw queries, connection ids, and a few other fields in the data mode browser. (Note that I’ve deselected most of the fields on the left side, so you can see the most important ones in this view.). If we remove the COUNT from “Calculate Per Group”, we’d automatically pop into this view as there’d be nothing to graph.

Screenshot: Raw Queries

Cool. So now we know how to find basic things like the breakdown of query types, normalized query families, how to dig into a database or collection to debug a QPS spike, search for a string or UUID in a normalized query family, or go deeper into a spike to see what has changed.

Now that we’ve covered the building blocks, we can take a look at more interesting questions. Such as:

  • Inspecting metrics like query durations, locks, held, or time waiting for locks—all of which are more meaningful than basic counts
  • RocksDB storage engine-specific characteristics (where you could use this data to debug tombstoned documents, memtable statistics, or compaction effects)
  • Tricks for tracking down connection origins or tracing unique request ids

Look for how to debug these problems and so much more, coming soon. :)

Enriching Nginx Logs with request_time, Server Data, and Other Goodies

How can you make your nginx logs more awesome? Nginx has some fantastic data hiding in its log_format spec, but oddly enough, most of it is not enabled by default. Here are a couple of variables to add to your nginx logs to help you get the most from them.

Two suggestions

$request_time: Hands down, the most important measurement for tracking the performance of a dynamic service is the response time of each request that comes in … and even that measurement is not enabled by default. I can understand how it used to be that way — way back when all you served were static files, response time wasn’t very interesting. In the context of today’s modern web, however, with all its dynamic applications, everybody should add $request_time to their log_format spec. It will show the amount of time it took nginx to process the request as a floating point number, representing the time in seconds (to millisecond precision).

$server_name: It’s also understandable, in the world of services logging to local disk, why the name of the machine handling the request isn’t added to the log line - it’s the same for every request. However, when centralizing logs or handing them off to a 3rd party service, it’s vital to add $server_name to the log line so that you know where to dig deeper when you see an anomaly.

There are tons of additional variables available to augment your nginx access log. I encourage you to go dig around the nginx docs and see what else might be relevant to your application. (If you’re configuring nginx as a proxy, pay special attention to the upstream variables.)

The Honeycomb nginx installer

We’ve identified a short list of useful variables to add to your nginx config. The Honeycomb nginx installer script will (in addition to downloading honeytail, our agent, and configuring it for your nginx server) give you some suggestions about which ones are missing from your log_format.

Try it out! Download instructions are in our docs.

The installer script will:

  • find your nginx config
  • find your log files
  • backfill a little bit of data (what’s in the current log file)
  • maybe suggest some changes to the log format to log interesting fields
  • start up the honeytail agent with the appropriate flags
  • give you a link to the dataset in Honeycomb with some suggested queries

Enjoy!

p.s. If you’re curious what the script is going to do before running it, feel free to look at the source.

Guest Post: Web Latency Spikes

Intro:

Our friend Issac Kelly has been working part time with us on marketing and copy. The first thing he did was set up Honeycomb for his own business. In less than 20 min, he had web logs streaming in to Honeycomb, and then discovered two unknown problems.

We were delighted, because surfacing unknown-unknowns is near and dear to our hearts. If you already know what’s wrong, the hardest part is often over! We asked him to write up what happened.—charity

Discovering and Exploring Web Latency Spikes

Last week I got a signup invite for Honeycomb. My consulting business has a website management platform with modest but steady traffic, about 30k req/day. I was interested in using Honeycomb to watch the day-to-day heartbeat of my application, and ideally spot anomalies before they become problems. When I immediately found two actionable problems I was floored.

Signup

I ran through the Quickstart, using curl and python to send my first few events. I found honeytail, and saw it had an nginx log parser which automatically inferred any custom log format from the config file. That is neat. I installed the package and started the agent, and then waited an hour for data to flow in1.

I let it run for an hour. I didn’t really know what to do when I got back to the Honeycomb console, but it had a pretty familiar SQL structure and pre-populated all the field names and calculations based on my data. Honeycomb actually saves the structure and results of all my queries, so I was able to go back later, retrace my path, and walk you through my thought process.

Exploring

I started with the default query hint: a COUNT(*) that displayed total requests per second over time. The default nginx logs are rather terse; I decided to add more useful information to my logs. I added $request_time to the log format, and restarted both nginx and honeytail.

Here is the nginx log format I ended up with:

log_format honey '$remote_addr - $remote_user' \
            '[$time_local] "$request" $status' \
            ' $bytes_sent $http_x_forwarded_for' \
            ' $host $request_time $upstream_response_time' \
            ' $pipe : "$http_user_agent" $server_port';
access_log /var/log/nginx/access.log honey;

Some events had a value for request_time and some had nils, but that was fine. I tried breaking down my query by $request_time and noticed there were spikes where the AVG(response_time) went well over a few seconds! This is a bad sign for a lightweight web site that isn’t serving a high volume of requests.

My honeytail invocation looked something like this. (The nginx.format argument is just the name of the log_format directive, seen above.)

$> ./honeytail/honeytail
    -k 10xhunter2a0
    -d 'API nginx'
    -p nginx
    -f /var/log/nginx/access.log
    --nginx.conf /etc/nginx/nginx.conf
    --nginx.format honey

I’m a pretty mediocre sysadmin—while writing this post I learned that AVG was not as meaningful a bucket as P95, P99, etc. Still, from this query I could see two spikes: one corresponded to a spike in the number of requests (at 3 PM) and one did not (4:15 PM).

Screenshot: Found a Spike!

The latency spike that didn’t correlate to a traffic spike happened again at 5:45PM, so I zoomed in to look more closely. The graph let me click and drag on the area around a spike to quickly zero in on that time range. I switched to the raw data inspector mode and saw that one page was taking about 5 seconds to render, which is how I discovered that a customer of mine had written a poorly formed template, causing slow queries and lots of rendering. I fixed the issue and moved on.

I added a filter for the problem URL to demonstrate how request duration dropped, while request rate stayed steady.

Screenshot: Response Time Drops

I also zoomed in on the 3 P.M. spike. I found out that they were intended for somebody else’s server. For some reason I am getting a stream of requests for somebody else’s server, because their DNS is pointing at my IP. The spike of requests was causing a latency spike for me, so I used nginx to ban requests from their originating IP so it couldn’t hit my backend Django services.

Conclusion

I solved two issues in one hour, neither of which I knew existed beforehand, and now I have a better feel for my baseline query latency and request rate. Now, as I build out more features, I can pay attention to how incremental changes affect performance.


  1. In retrospect, I didn’t actually have to wait an hour for the data to populate my dataset—I could have replayed older logs into the dataset using the same honeytail utility. [return]

How Honeycomb Uses Honeycomb, Part 2: Migrating API Versions

Continued from How Honeycomb Uses Honeycomb, Part 1: The Long Tail

We recently released a new version of our API. As scarred veterans of building and supporting APIs, we made sure to retain backwards compatibility. Our code paths are versioned, but we’ve also versioned our docs to match. These things are good for developers even though they come at a cost — it takes time and effort to make sure that things continue to work.

We have a strong interest in encouraging our customers to upgrade to the new API, especially at such an early stage, when we are shipping radical improvements almost every day.

One of the fields that we include with every event we send in to our dogfooding cluster is the User-Agent string provided by the client. Most of our libraries put useful information in the User-Agent field for later consumption, but few folks think of it immediately as something worth indexing by.

Let’s find out how many datasets are representing each version of our client library, by setting up a query to track unique User-Agents and seeing how many datasets were associated with the distinct User-Agent values:

Screenshot: Datasets by client version

We can quickly see that there’s only one client using the current version, one client using the previous “older” version, and 5 clients using the oldest version. This is clearly something we should work on fixing. But who should we talk to first? The number of datasets using each version is not a good indication of the importance of each one, as someone sending tons of traffic will have more of an impact that someone with just a trickle of traffic.

Let’s ask for the same breakdown, but by traffic volume instead of the number of datasets:

Screenshot: API client with the most traffic

There is one clear candidate to chase down first, and a strong second place finisher. After that, there are a number of clients that should convert, and after that the long tail that has much less impact.

If you have a strictly limited set of fields you can aggregate on, as with many time-series column stores, User-Agentis usually not one of those few precious fields. But with Honeycomb, where you aggregate on anything and everything, it suddenly proves its worth.

As progress drives on you may have many, many versions in the wild. Honeycomb lets you break down any arbitrary number of versions combined with volume + other factors, displaying segments of customers to nag, beg, encourage, and finally deprecate or limit if they have fallen too far behind for you to support.

We’ve all been in the position of needing to urge customers to upgrade their clients. With Honeycomb, you could also bolster your arguments by comparing performance, error rates, etc for each of the older versions versus the new and improved release.

Screenshot: The new overtakes the old

When the high value client we found above actually did the cutover, watching the traffic switch from one version to another made for a very pretty graph. :)

Happy metric-ing!

Get Started!

Sign up to try Honeycomb for free!